
Data is useful. But it's also sometimes just numbers. What's the story, if any, behind reams of numbers and statistics? Iris Sun shows how immigration source country data can come alive in simple ways (thanks to Nick Noorani for sharing). In these data visualizations, trends immediately jump out at you. She's made the data interesting and accessible.
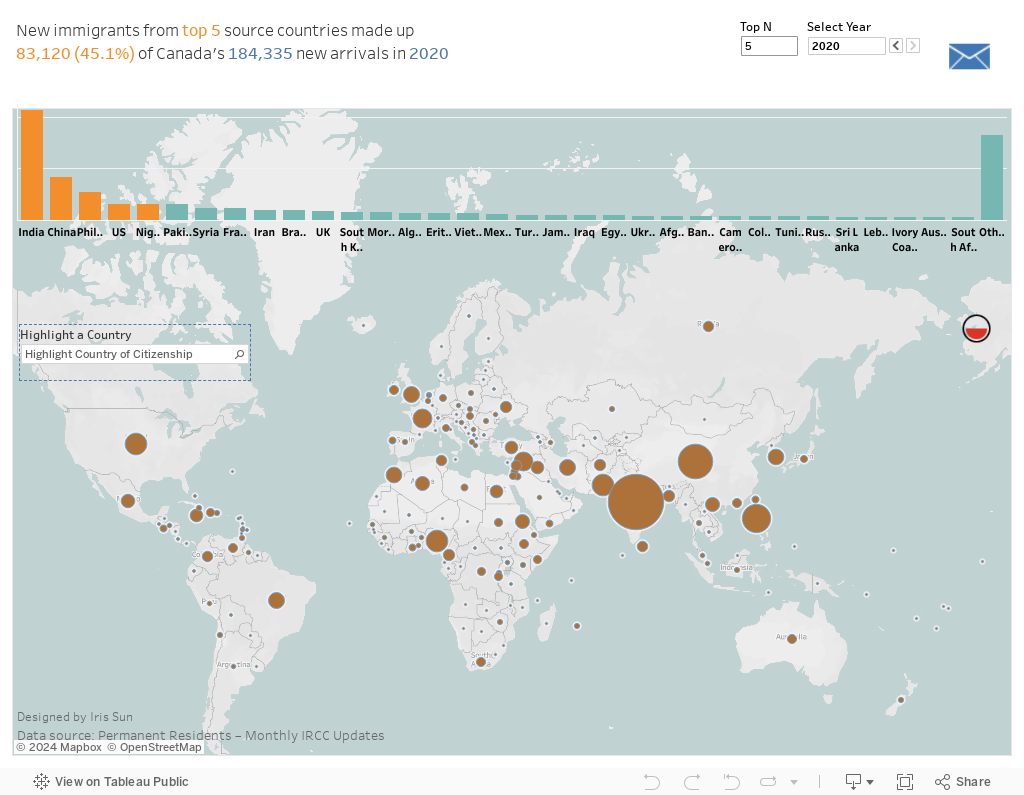
She writes: "COVID-19 has a significant impact on Canada’s immigration system. Canada admitted 184,000 new permanent residents in 2020. It fell short of the immigration target of 341,000. Despite the drop off, the top three countries of new permanent residents remained the same as 2019, with India dominating in 1st spot accounting for 23% of new admissions. Under Canada’s new 2021-2023 Immigration Levels Plan, Canada aims to accept over 400,000 new immigrants per year. Achieving this target will be challenging, but Canada government is preparing to climb the mountain. Hover over the map and bars for details. Select a bar to view the country on the map. Data source: IRCC Open Data Portal"
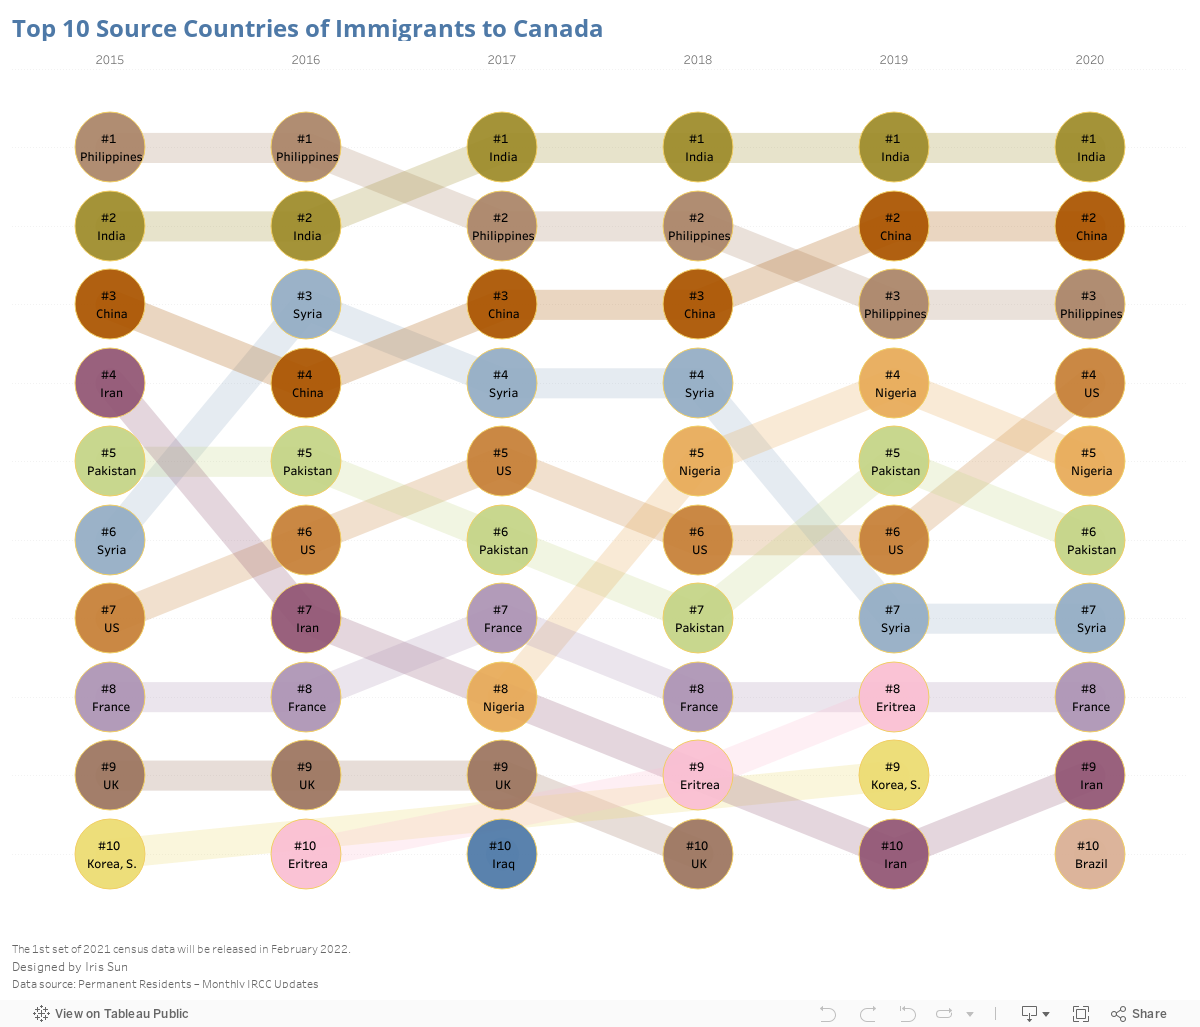
Top 10 Source Countries of Immigrants to Canada - 2015 - 2020
Just following along with your eyes tells us a story. And it makes me want to know more. What happened to Iran and why the decrease? Brazil is suddenly in the top 10. Why? Syria may have dropped off many people's radar with so many other tragic humanitarian stories out there. But it hasn't dropped off our immigration patterns.
Where Did Canada’s New Immigrants Come From?
This second visualization gives us a global view of immigration source countries. A simple visual or a larger or smaller circle gives you an immediate sense of where Permanent Residents came from. Highlight or mouse over a country and you can see a quick view of immigration patterns between 2015 and 2020. Interesting trends for sure.
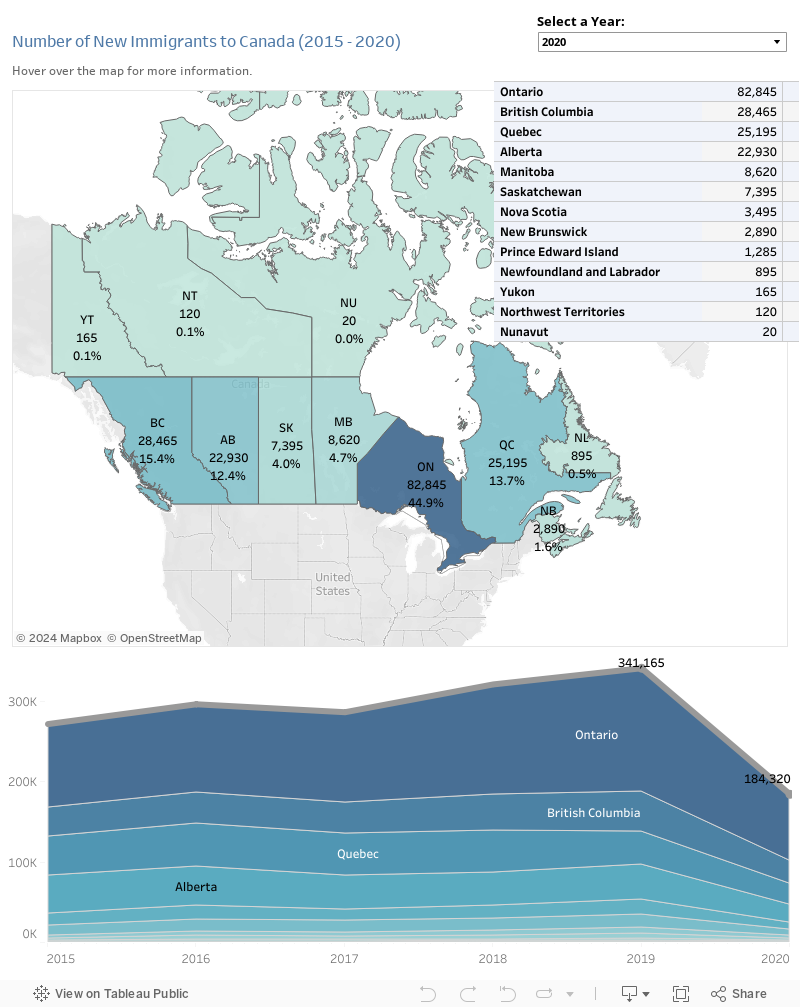
IRCC Admissions - Permanent Residents (2015-2020)
Curious where all classes of Newcomers ended up in Canada? Mouse over provinces to see total numbers, percentages by category, as well as percentage of national total. The image at the bottom shows you the ebb and flow of Newcomers landing in each province between 2015 and 2020.
Subscribe to get the latest posts sent to your email.
Please take this short survey to help improve the KM4S web site. The survey is anonymous. Thank you for your feedback! (click on the screen anywhere (or on the x in the top right corner) to remove this pop-up)